December 2012
The What’s New at Stock Trading Warrior Newsletter brings you stock trading news, analysis and tips. In this month's newsletter you'll find information on the following:
- The Stock Trading Warrior's Guide to Market Trend
- STW Comedy Corner
- 2012 Stock Market Holidays
- Stock Pix - Hot or Not?
Beginning in January 2012, each month the Stock Trading Warrior Newsletter will focus on each part of a strong, stock trading system to help you create or fine-tune your stock trading performance.
Merry Christmas and Happy Hanukkah!
Let's make 2012 your best stock trading year ever!
The Stock Trading Warrior's Guide
to Today's Market Trend
Today's Market Trend
Understanding the general market trend gives traders and investors knowledge about when to enter, exit or pause on new positions. The reason this is so important is that new positions can strongly benefit from following market trend direction. A strong trend will help to "pull" the price of new positions which increases your advantage for managing the downside risk of a position.
There are a variety of ways for you to determine market direction quickly and easily. However, listening to other people's predictions about market direction takes a back seat at Stock Trading Warrior to reading market direction yourself. Remember, as we are only able to look at what the markets are doing today, people's opinions about the future are limited by what is known today too. The difference is that basing trades on predictions are that they are less probable to come true than reading the markets as they are today and making sound trading decisions.
The technical method I use to
read market direction
is the
Average Directional Indicator
(ADX) and the +/-DI to analyze market direction every day. The ADX is extremely useful because it takes into account not only the trend, but the strength of the current/emerging trend based on the period history.
On a daily chart, the default period history is 14 days, but the time periods can be adjusted on many indicators to fit them to your typical hold time for a position. For example, with the ADX, a long-term, year+ investor might just use the default of 14 days. For stock positions that are typically held for several weeks to a few months, the ADX time period of 7 works well.
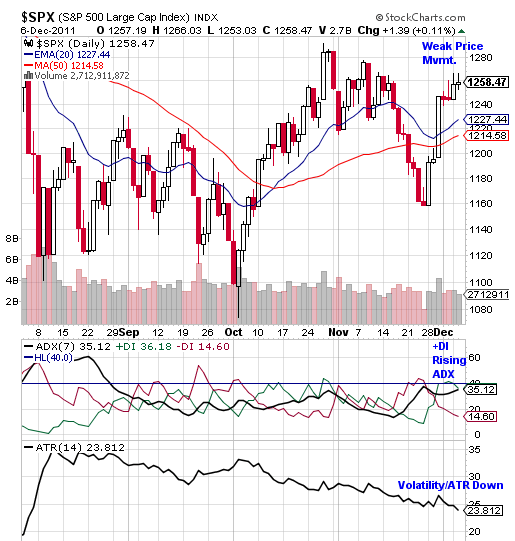
Let's look at the $SPX along with the ADX (7-day) to determine the current trend.

As you can see above on the daily chart of the $SPX, the ADX line (black line) has indicated an upward trend though price is looking weak. Using the ADX, the trend is determined by the +DI (green line) over the -DI (red line) and the ADX line steadily moving upward.
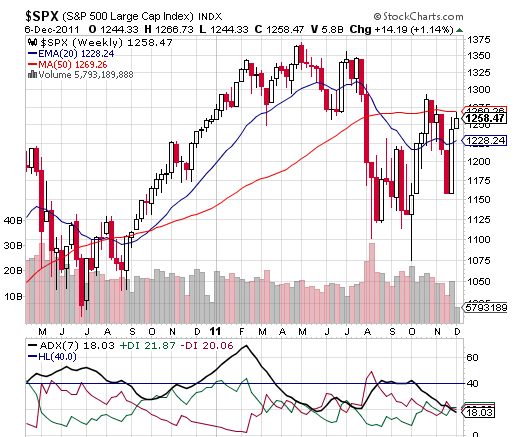
With weak price movement, sometimes it helps to look at a weekly chart to get some perspective.

The weekly chart shows the ADX (7) lower than it's been in more than two years. This confirms the initial concern about a lack of confidence in the markets.
So, what to do? What's the bottom line?
The bottom line is that the market is in an uptrend. But, looking at the daily chart of the $SPX over the last week, price seems to be hitting some resistance, indicating that confidence is not strong. This is reason for caution. If you're looking at entering new long positions, I'd wait until there's a renewed sign of trend (+DI spike upward) and price strength in the daily chart.
Looking at the ADX along with an index is a quick way to know when to get into a position and gives you the best opportunity for a gain.
Note: In the last newsletter I talked about the $SPX's
Average True Range
being very high. Since then it has continued to move down signaling that the volatility of the markets is lowering. This can be taken as a good sign, because historically, market rallies occur with lower volatility as investors resume confidence about getting back into the markets.
STW Comedy Corner
This month's comedy corner is a stock trader version of 'Twas the Night Before Christmas from our friends at Investopedia. Investopedia.com is a top resource for stock market and investing information.
Click here to read the full fun and clever version of 'Twas the Night Before Christmas. Enjoy!
2012 Stock Market Holidays

Every year there are stock market holidays that sneak up on me so this year I'll be noting the 2012 Stock Market Holidays in my calendar. Maybe you'd like to do the same -
2012 Stock Market Holidays.
Stock Trading Warrior Pix
Hot or Not?

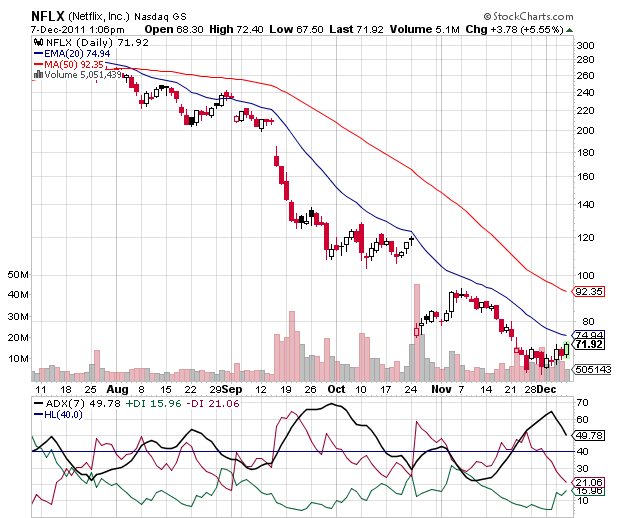
Netflix (NFLX) is NOT HOT as many of you already know. The funny thing is, I still see people asking about whether now is a good time to buy NFLX. NFLX isn't the first stock to have a questionable future AND have people still looking to buy it because they think it's a good buy at this low price.
Stock Trading Warrior is here to pound tables, scream from atop mountains and be completely zealous when it comes to buying a stock that doesn't have any technical reason to buy into it. If you're not using a technical indicator to help make buying decisions then you're not giving yourself the best opportunity for investing success.
There are some simple technical indicators that can be used very easily and efficiently for making buying decisions like: RSI,
moving average lines,
the average directional index
or
parabolic SAR.
Looking at the NFLX daily chart, the 20-day moving average line is below the 50-day moving average line. Until those lines cross, NFLX should not be considered a buying candidate. Period.
Just this one simple technical rule will dramatically increase the possibility of successful investments.
Next...!

This one's setting up for the possibility of HOT!
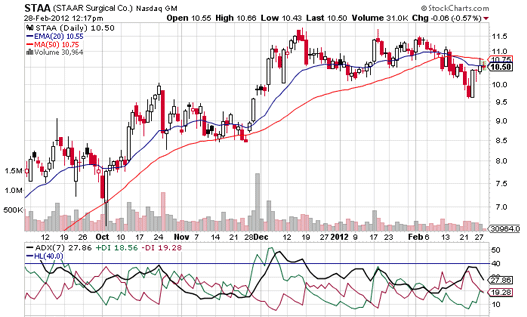
STAAR Surgical Co. (STAA) has set up in the
ADX Double DI Strategy
for a second leg of an upward trend. The buy price is $11.11. There's something to especially like which is the recent, big volume day. It stands out above the average volume levels. Let's watch this stock to see what it does over the next month.
Update: Last month's stock watch, STMP, sold out on November 2nd at $27.73 for a 35% gain in just under a two month hold.
The ADX Double DI Strategy looks for stocks like STMP that are setting up for strong momentum plays to hold for a week or two - up to several months. The ADX Double DI Strategy is described in detail, along with other trading plan strategies in the book:
The Stock Trading Warrior's Guide to Finding the Biggest and Best Stock Market Gainers Using the ADX Double DI Strategy.
It makes a great Christmas Gift for the Stock Trading Warrior in your family!

Click here for more information about the ADX Double DI Strategy ebook.
If you have any stock trading questions at all, please submit them on the
Stock Trading Warrior contact page.
Look for next month's newsletter for more current stock market news and analysis.
Thank you for reading What's New at Stock Trading Warrior!
For additional stock trading information and tips, please visit
Stock-Trading-Warrior.com
If you enjoy this ezine, please feel free to forward it to your friends. If it was forwarded to you and you'd like to subscribe, please do so by visiting
Stock Trading Warrior Home
and sign up using the opt in box.
|


