


|
Look at the Stock Market Trend Before You Buy Stocks
If you sometimes feel like the tiny boat, then the topic of how to determine the stock market trend will help to change
that by giving you the ability to trade with more confidence. A trend is the direction that price is moving and will either be an uptrend, a downtrend or a sideways trend. The main point of looking at market trends is to buy into an upward trending market rather than a downward trending market - unless, of course, you are prepared to sell shares short. Either way, checking on the market's direction will give you a better chance at a gain rather than a loss. It’s a little like some turbo boost action on your trade if you're taking a long position and it's risk management when you can read when the market is going against you. This series on stock market trend includes this page which covers a few indicators you can use to read the market trend direction and two other indicators of market sentiment. Additional pages in the series include the following two webpages:
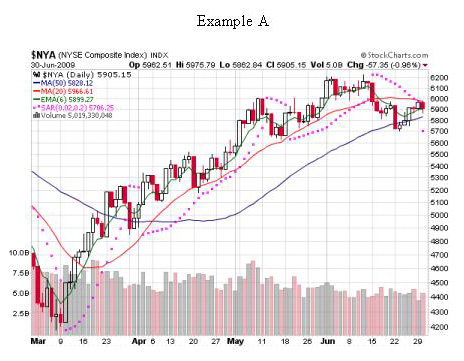
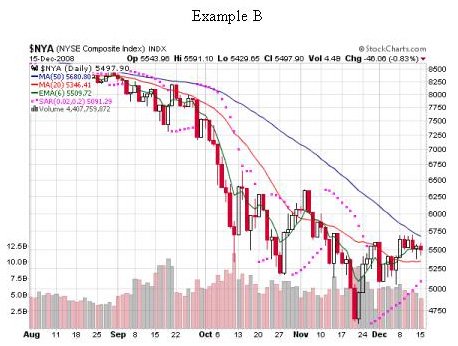
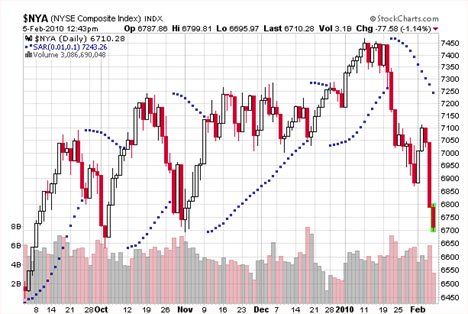
After looking at those two charts, you can see how important it is to know how to read market direction so you can decide when to get in and out of a position or even when to stay in cash. If you’re already in a position, a change of stock market trend can signal you toward the defensive side of trading and act as a warning to protect your gains and your capital by tightening your stops. In the example above, when an indice's price goes below two or more moving averages (blue, red and green lines on the chart) it's a clear signal not to enter long positions. If you do, it's likely you will lose money and that's not what we're here to do. If you're a longer term investor, rather than dollar-cost averaging by buying into stock positions at the same time each month, consider spending a few moments looking at market trend before increasing positions. If the market is trending downward, a strategy to try is to keep the monthly money in cash until the next month while looking for signs of a trend reversal. After a few months, see if timing entries to a trend signal increases overall gains. Here are some good and easy places to look for clear indications of market trend, whether you’re a long- or short-term investor. These things string together a pretty good picture of what's happening in the market. Click on any of the headings for a more detailed explanation and additional examples of the following:
This is the indicator I personally use to determine whether to enter long or short positions or to stand aside in cash. It also helps me to see if I should tighten my stops when trends begin to weaken.
ACTION STEP: Pick one or two of the above indicators that makes sense to you. Click on any of the headings to understand more about any of these helpful market trend indicators. Begin taking a minute or two looking at an index of your choosing with the indicator(s) on a daily or weekly basis depending on your investing style. After a short while, you will be in tune with the stock market trend. You'll begin to easily see and act on shifts in the markets which will give you more confidence and your trades a higher probability of success.
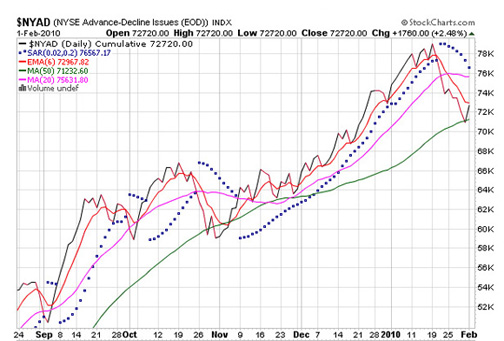
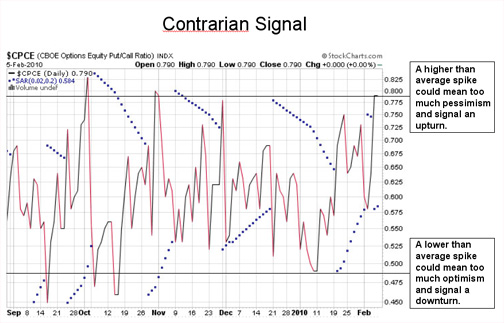
There are a couple of other things you can look at to help determine market direction like overall trader or market sentiment. Market sentiment is sometimes called “crowd psychology” as it relates to fear or complacency. Two indexes that assist with this are the Advance-Decline Issues Index and CBOE Options Equity Put/Call Ratio Index. They simply give you an additional perspectives on what's happening in the markets.
And lastly, a tool for helping gauge the future stock market trend is the $CPCE (CBOE Options Equity Put/Call Ratio). If this sounds intimidating, don't worry, it isn't, but if you find that it is more than you need or want to know that's ok. The other market trend indicators will serve you just fine.
These aren’t hard and fast signals to live by, but they do offer a legitimate view of what the markets are doing at any given time. We, as Stock Trading Warriors, not market makers, have to follow different rules of engagement. Reading stock market trend is not an exercise in attempting to predict the future, but a response to the markets as they are. Remember, no one can predict the future. Move on to the next step in determining market trend - by studying the king of trend indicators, Average Directional Index (ADX). Return from Stock Market Trend to Creating Stock Market Systems that work! Return to Online Stock Trading Warrior Home. Don't Forget to Check Out |
 After placing a trade and watching the stock price fluctuate, do you sometimes feel like a tiny boat being tossed around in a stormy ocean or a cruise liner diverted from the storm and cruising in calm waters?
Search Stock Trading Warrior
Learn about Options

Options are a solid weapon to have in your investing arsenal to hedge positions or manage risk. Learn from the 2019 U.S. Investing Champion, Trader Travis.
Stock Market Insights
Want a peek at DOW Jones Industrial Stocks that are beginning to trend?
Click HERE!
Learn Trend Trading!
Free Videos
Presented by 30year Market Veteran Adam Hewison
What really makes a stock price rise? To find out watch:
Stock Market Insights
How a Simple Line Can Improve Your Trading Success
"How to draw a trendline" is one of the first things people learn when they study technical analysis. Typically, they quickly move on to more advanced topics and too often discard this simplest of all technical tools. Read more...
a Trend?... Find Out Now!
Online Stock Brokers
Read the online brokerage discussion...