Stock Market Trends
and the Average Directional Index
"The Trendinator" – Part I
SPONSOR:
The trend is your friend! Click here to see the Top 50 Trending Stocks.

You can know just about everything you need to know about trading, but if you don’t know how to read stock market trends you’ll have a difficult time being very successful.
One of the best indicators for reading market trends is the average directional index (ADX) because it is specifically a trend indicator. Unlike the other indicators like moving averages and parabolic SAR that can help with trend following and confirmation, the ADX can give a consistent trend reading of upward, downward or non-trending.
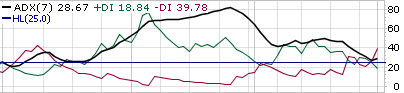
The ADX is a powerful tool and is the Terminator of technical indicators. It could even be called "The Trendinator.” It's a non-directional technical indicator which means that the indicator line will rise to a higher rating even if the stock's price trend is downward. The black line simply gauges the trending strength of any price move while the +DI (green line) and -DI (red line) indicate if the price is increasing or decreasing.
Below is an example of what the ADX indicator looks like. For more specifics about the average directional index works visit
Average Directional Index (ADX) – The Little Indicator That Could.
What you’re looking for in determining market direction is to be able to read, and interpret whether the market is in a up or down trend, if it looks like it’s losing momentum and might reverse, or if it’s in a range bound market.
For investors, it's worth considering using this simple indicator to determine stock market trends to signal when to place funds into current stock positions and when to pause, keeping new money in cash until the market shifts back into an upward movement. Over time placing money in an upward moving market could make the overall stock investment portfolio more successful.
And for traders, knowing the market trend will add some turbo boost into your trades and increasing the probabilities in your favor.
Upward Average Directional Index Trend
When the ADX line begins a steadily upward moving rise over 25, the +DI is above the -DI and +DI is also above the 25 rating that is a setup for a new uptrend. When you see the ADX and +DI lines rising steadily it signals that a trend is gaining momentum.
With trend reading, capturing the majority of the trend rather than the total trend is the goal. You should want a decent confirmation that the market is in a new upswing. The meat of the trend in the example of the $SPX chart below truly begins on March 5th. Again, you're looking for the steadily rising ADX line.
When the general indices are trending upward that's a good time to enter new positions.
Downward Average Directional Index Trend
Downtrend setup occurs when the ADX line begins a steadily upward moving rise over 25, the -DI is above the +DI and -DI is also above the 25 rating as in the example below.
When the stock market trend is down, the action is to take no action. No buying should occur while a downward trend is in place. Enjoy being in cash or look to go short, but don’t buy. The probability that you will find one of the small handful of stocks that will do well in a downward market is slim.
And even if you find a long stock candidate that has setup correctly on a strong up day, if the downward market trend continues the probability is it will most likely put too much pressure on the price of the stock you found. It’s like swimming against the tide. You can try to do it, but it will wear you out and the tide will ultimately win the battle.
In the end it’s just not worth it. Use strong discipline in this area and watch your success rate go up.
Range-Bound Average Directional Index Trend
When the ADX line goes below 25 you'll often see the +DI and -DI gyrating around each other as in the example below, this signals a non-trending or range-bound market which can be tough to trade in. Positions are generally held for a shorter amount of time or one can simply stay in cash until a stronger trend emerges.
The ADX is the strongest trend indicator and should be used regularly to determine trend. Besides ADX, moving averages and Parabolic SAR can confirm trend and other informative sources that can help with trend are advance/decline issues and the equity put/call ratio which can provide assistance with an indication of buyer and seller sentiment.
All of the indicators mentioned here including "The Trendinator" can also be used for reading individual stock trends, but determining stock market trend first sets the stage for whether you should go long, short or stay in cash.
Return to determining Stock Market Trend.
Return from Stock Market Trends to Online Stock Trading Home.
Want to Know If Your Stock's In a Trend?