Average Directional Index
The Little Indicator that Could
SPONSOR:
The trend is your friend! Click here to see the Top 50 Trending Stocks.


The average directional index (ADX) is something that can have a tremendous impact on the success of your trading or investing. No matter what your stock trading strategy, after you learn about the power of the average directional index movement you might feel like somebody finally turned a light on!
The ADX is a technical indicator created by J. Welles Wilder and is used to determine if a price is trending up or down and measures the strength of that trend.
The ADX can be used to identify:
Individual Stock Trends
In most customizable charting programs you can add the ADX indicator graph (example below) to your charting and it is displayed in a separate graph area above or below the main price chart.
Average Directional Index Example
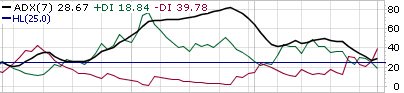
The average directional index rating is displayed in the form of the single black line that moves between a range of 0 to 100, though you will rarely see readings of exactly 0 or 100.
The average directional index line is a nondirectional indicator, meaning that the line will rise to a higher rating even if the price trend is downward. The line simply gauges the strength of any trending price move. The default setting for the ADX indicator is usually 14 periods, but it can be adjusted if you trade in a shorter or longer time frame.
There are two other important components to the average directional movement index rating shown in the above box as well. There's a green line for +DI (positive directional indicator) and a red line for –DI (negative directional indicator). These additional lines help by indicating an upward or downward moving trend.
The bold line on the graph at the 25 rating mark is considered the threshold for a trending stock price or non-trending if the ADX line is below the 25 mark.
The average directional movement index rating system is as follows:
Below 25 is non-trending or a range-bound market or stock price
Above 25 is the beginning of a trend
Above 40 is considered a strong trend
Above 60 is a very strong trend
Above 80 is an extremely strong trend
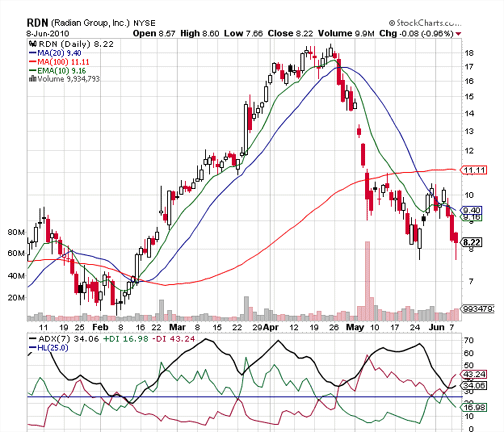
In the example of RDN below, you can see that each time the ADX line rises steadily with the + or -DI above 25, the price trends up nicely.
The ADX can help you with any stock purchase or decision about when to sell by giving you a clearer picture of what a stock price is doing.
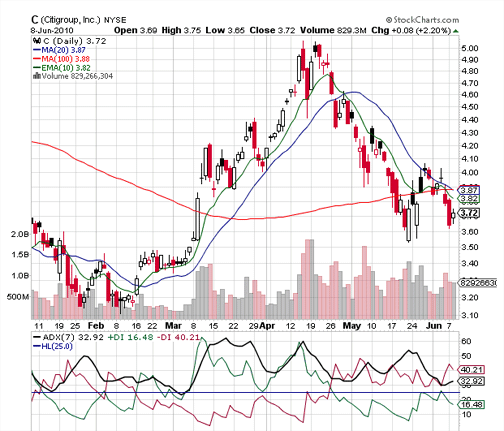
Another example of a stock that gets talked about a lot is Citigroup (C). As the price moved down, people were wondering if now was a good time to get into a long stock position with C. Just looking at the price chart without the ADX, you can see it looking like it wants to resist the downward movement and bounce upward.
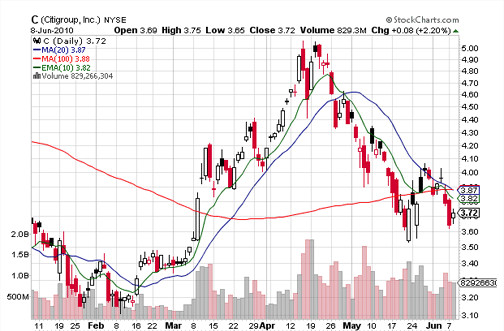
But when you add the ADX indicator to the chart you get a better picture of the stock's trend. The +DI never crossed over the -DI and it barely touched the 25 rating mark. Looking at the ADX, you can get a clear picture of a stock that's still in a downward trend.
By applying the ADX strategy to the general stock market trend a trader wouldn't be buying into anything right now based on the
stock trading probability
that most stock prices follow the general stock market trend. Take a look below at the chart of the NYSE Composite Index which confirms a continued downward trend. It's not a time to be buying.
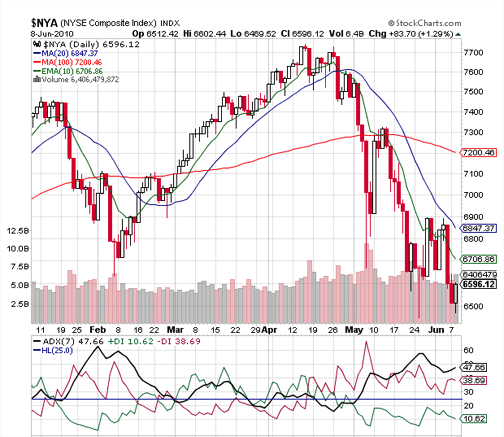
Armed with this information about how to interpret trend using the average directional index (ADX), you can make huge improvements on your buying
decisions or if you're comfortable selling short you would have been signaled to take some short positions by May 4th.
If you are looking for one thing that can really improve your trading or investing level of success, this is it.
To further explore ADX and trends move on to
stock market trend
or
individual trending stocks.
Return from Average Directional Index to Stock Market Trend.
Return to Online Stock Trading Warrior home.