Trending Stocks
Trend Trading for Big Gains
SPONSOR:
The trend is your friend! Click here to see the Top 50 Trending Stocks.

 How to Find Trending Stocks
The trend is your friend, right? Well then, who’s your enemy? Any stock that’s in a gyrating, non-trending part of the trend!
You’ll often hear that there’s no holy grail in stock trading that works every time and is always reliable - and that’s true. However, the goal for all stock traders and investors should be to use available tools to make the best decisions for when to buy and sell stocks. In trend following, finding a newly trending stock can be done using the average directional index.
The “Trendinator” or average directional index (ADX) is a nondirectional technical indicator with two additions: +DI (green line) and –DI (red line) as shown in the example below.
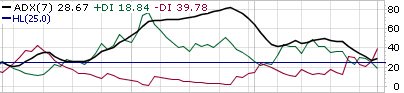
The fact that the ADX line is nondirectional means that the indicator line will rise to a higher rating even if the price trend is downward as you can see above in the first line break over 25 (indicated by the darker horizontal line). The ADX line simply gauges the strength of any trending price move and helps to confirm trend trading choices.
When the ADX line begins a steady upward moving rise over 25, that signals the start of a trend. If the +DI is also above the 25 rating and has crossed over the -DI that is a setup for a new up trend. As the ADX line rises steadily it signals that a trend is gaining momentum.
As you begin to look at ADX you’ll notice lines that are moving strongly and some that move sluggishly. It shouldn’t be jumping too sharply up, but a nice steady rise as in the example above.
With trend trading, the real trick is to capture the majority of the price trend rather than the absolute bottom to top move. Don't sweat a 5-10% price gain prior to buying because if the trend is "acting right," it should continue to move upward. Rather than rushing into a position you should want a decent confirmation that the stock is in a new upswing. If it goes against you, your
stop loss order
will protect your capital.
Let’s pull some stocks from the
Best Stock Trading Charts of 2010
to examine how the ADX works to find trending stocks.
Looking to an example of how to participate in trend following, let's take a look at Telestone Technologies Corp. (TSTC) which gained over 1,000% in 2009. I chose a smaller time frame in which it gained approximately 300%.
On September 10th, the ADX was just crossing over the 25 rating with above average volume. As you can see, the ADX and +DI stayed above the 25 rating until about October 28th. However, just using ADX as a sell signal would have given up around 32% from the highest closing price. A bit too much for my taste and you really don't ever know if a stock price is going to bounce up or tank.
Price should always be the determining factor for
selling stock
and should be set at a pre-determined sell point based on your
stock trading plan.
After the ADX went below 25 after the first gain, on November 11th it set up again moving up over an ADX rating of 25 with the +DI on above average volume.
This is a trend trading pattern you see with some of the very successful trending stocks. They have good, upward momentum, take a breather and then restart the upward movement. Look at some of the best gainers and that's what you'll see. Some traders that like to
swing trade
focus on these guys and wait for the breather and early signals the trending is restarting.
The next stock example for trend following we'll look at is Dollar Thrifty Auto Group (DTG). In 2009, it gained over 1,900%!
By March 23rd the ADX crossed over the 25 mark with above average volume and made a really gorgeous climb for over five months.
To find trending stocks indicators are almost always used, but a common complaint of indicators is that they lag. To better adjust for lag, you can adjust most indicators including the ADX to different time frames tailored to your stock hold time. For example, a shorter term trader wouldn’t look at a 14-day ADX reading. A short to mid-term trend trader might use the 7-day reading. However, a long term investor would use the 14 day reading.
Once you begin looking at ADX for individual stocks, you’ll have a very good way to instantly gather information about that stock. You can also use the
average directional index for stock market trends
too.
Keep in mind, there are other indicators you can use to determine an individual stock or market trend as well, like
moving average indicators
or the
Parabolic SAR indicator.
The Average Directional Index is a terrific indicator for trend trading and if you want to read more about it take a look at
Average Directional Index – The Little Indicator That Could.
Return from trending stocks to Online Stock Trading Warrior home.
Want to know if your stock's in a trend?