


|
Parabolic SAR Indicator
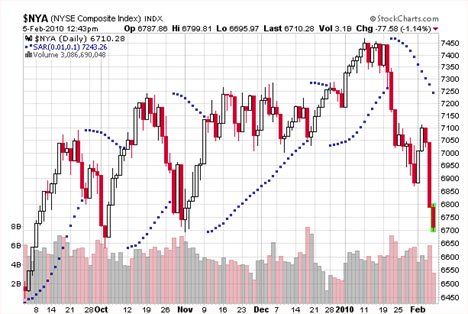
The parabolic SAR’s position is indicated by the dots above or below the candlestick bars and like other indicators (e.g., moving averages, Bollinger bands, etc.) it’s an overlay that can be turned on in many free chart programs and charts provided to you by your online brokerage or chart subscription service. A way to describe the parabolic SAR indicator is to liken it to a trailing stop of price action. Just like a trail stop that can be placed on a stock you own, the parabolic SAR’s value takes into consideration the maximum price point in an upward trend or minimum price value in a downward trend adjusting for each time period and then applying that figure to the next day’s price action. When the series of dots switch from above the candlestick bar to below that signals that the market is beginning to move upward and the upward moving price will pull the dots upward. When the dots switch position from below the candlestick bar to above that means the market is shifting toward a decline. Here’s an example of the NYSE with the parabolic SAR overlay turned on:
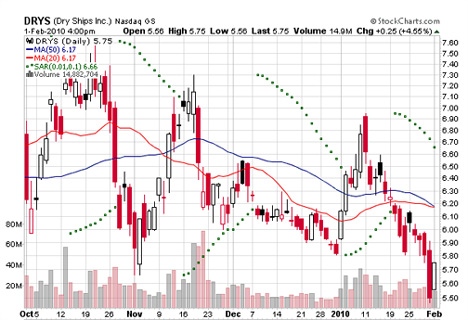
If you’re comfortable shorting and had some good candidates, then a couple of weeks ago would have been a good time to do so. One thing to note: the default setting for the parabolic SAR is usually 0.02,0.2. However, for stocks the setting should be 0.01,0.1 to avoid too much sensitivity and the parabolic SAR switching above and below the price bars too frequently. When those switches around occur more frequently, it’s called a whipsaw and you will see more whipsaws in a non-trending market. Hard to know when you’re going to experience a non-trending whipsaw period or a real market direction change, but what can help with this is using Moving Average (MA) lines. If you see MAs that are flat or horizontal looking you can expect to see more whipsaws and the price shifting back and forth more regularly as in the example of DRYS below.
The following example of FUQI shows a trending stock. You’ll notice the MAs are trending upward and the parabolic SARs are mostly below the price bars and when they do switch to above, the dot sequences are short and remain pretty flat. 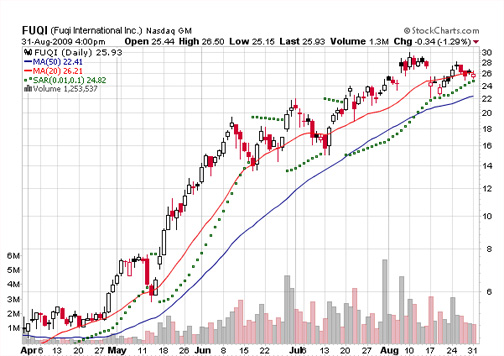
One thing to mention about the parabolic SAR indicator is that it can lag a bit after a market or a stock has begun to turn. That's why it's always good to have a real sell point set to lock in profits. However, as you have seen, it still is a good signal that a trend is slowing or shifting. There are also other indicators you can use in conjunction with the parabolic SAR like the ADX indicator which will help to determine if a stock or the markets are trending or non-trending. The parabolic SAR indicator is just one of several ways to
determine stock market trend.
|
Search Stock Trading Warrior
Learn about Options

Options are a solid weapon to have in your investing arsenal to hedge positions or manage risk. Learn from the 2019 U.S. Investing Champion, Trader Travis.
Stock Market Insights
Want a peek at DOW Jones Industrial Stocks that are beginning to trend?
Click HERE!
Learn Trend Trading!
Free Videos
Presented by 30year Market Veteran Adam Hewison
What really makes a stock price rise? To find out watch:
Stock Market Insights
How a Simple Line Can Improve Your Trading Success
"How to draw a trendline" is one of the first things people learn when they study technical analysis. Typically, they quickly move on to more advanced topics and too often discard this simplest of all technical tools. Read more...
a Trend?... Find Out Now!
Online Stock Brokers
Read the online brokerage discussion...