Technical Analysis Stock Trading What is technical analysis in stock trading?
If you find yourself asking – what do I need to be successful in the stock market – the answer is technical analysis. It doesn’t matter if you’re a long-term investor or a short-term trader. Technical analysis will make you a better trader.
Technical analysis is the study of how the price of a share of stock or index is moving on a
stock market chart.
It usually involves the use of an indicator or oscillator to measure various aspects of price, including trends, price ranges, price and volume combinations, rate of change, etc. The idea for using technical analysis is that prices are not completely random, but rather, they follow price patterns.
If you look at a chart you'll see that daily prices for the most part, connect from day to day. The daily price of a stock has a relationship with the prior day’s action and so on. Even stocks with volatile price movements have a day-to-day relationship and subsequently, create a pattern of movement.
If we go a little deeper, technical analysis is also a way to read true trader sentiment about a stock because what makes the price of a stock go up or down is whether the majority of traders want to buy it or sell it. And so, price patterns are created when buyers and sellers react/respond to price action.
There are many more specialized indicators, but the ones listed above are probably the most popular ones.
For a more detailed explanation of the unlinked items above visit Investopedia.com. It's a great stock market resource.
Technical Analysis Stock Trading - Why?
Know Where Price Is
A reason to use technical analysis stock trading is you should want to have, at least, some basic knowledge of what any stock’s price is doing before you buy it. Otherwise, if you have absolutely no knowledge of what price is doing – you’re basically buying in a vacuum. Most stock traders want the price to be moving in the right direction to capture a gain and that’s why technical analysis is so important.
Fundamentals Aren’t Enough
To put it in perspective, traditionally, there are two general ways to pick stocks. One is to use fundamentals or the financial numbers of a company. The idea in using fundamentals is to look for numbers based on
growth
or
value
that appear to tell a story of how the price of a share of stock would be expected to move.
To assume that a stock price must go up because of earnings, low valuation, etc. isn’t enough information to make really good trades. There’s example after example of stocks that have good fundamentals and aren’t increasing in price.
The way to be successful as an investor is to combine fundamental study with some kind of technical analysis stock trading. Using technical analysis, a stock trader is reading what the price is currently doing and making trading decisions based on more information than just fundamentals.
Human Psychology
As mentioned above, the way price is moving describes what the majority of people interested in the stock really think about it and where they think it’s going to go. If you really think about why the price of a stock goes up –it’s because people are buying it. So why do people buy a stock? There are a lot of reasons why, but does that truly matter? At the end of the day, what really matters is how the price is moving and that's how technical analysis stock trading comes into play.
And, the interesting thing is that human psychology repeats itself. If a stock is popular – like the popular kid in school – and people are buying it that will make its price go up.
If You Knew of A Way to Read Price Would You Use It to Your Advantage?
If you had a way to clearly understand that the price of stock was moving upward before making a decision to enter into a position wouldn’t you use it?
On the flip side, if you had a way to read that many people were exiting the position in the stock and driving the price down wouldn’t you want the opportunity to exit before you felt like you were the last shareholder?
Additionally, many traders and investors use financial news stations to gather information to influence trading activity when price movement will tell you what it’s actually doing. Why not use an unbiased tool that offers the information you need at a glance using what is rather than what might be.
Technical Analysis Stock Trading - How?
Here are some easy ways to use technical analysis in your trading with one or two applicable indicators:
Trend - Look to see if the stock price is in a trend? Is it going up or down? Is it a newly established trend or a stale one? (Indicators:
Moving Average
[MA],
Average Directional Index
[ADX], MACD)
Support/Resistance – Look to see if the stock price headed toward a recent previous high or low in price? And how will the price act when it hits the same level as a recent high or low? Will the price move stop and reverse or break through? Or is the stock at a 52-week high or low and facing no resistance? (Indicators:
Moving Average
[MA], trend lines)
Volume – Relates to interest in a stock. Abnormal volume can indicate abnormal buying or selling activity. (Chaikin Money Flow, OBV, Rate of Change [ROC])
Price patterns – supply & demand has the price gone up really fast with no pause? Or has the price movement “rested” and begun to continue in the trend direction? (Japanese Candlesticks, Cup with Handle)
Personally, the technical indicator I mainly use is
ADX to find trending stocks
then price (Japanese Candlesticks). Simple, and not overly complicated.
When deciding what technical analysis stock trading indicator you want to use think about what you are most interested in whether it be trend, support/resistance, etc. and what makes the most sense to you.
Additionally, a trader can use both fundamental and technical analysis together.
Technical Analysis Stock Trading - Next Step?
The best thing to do is pick a handful of individual indicators and read about them. Start looking at them comparing the information they provide with how the price moved on a group of stock charts. A good book to get started with technical analysis is The Visual Investor: How to Spot Market Trends (Wiley Trading)Investing Books)
.
Then look at the stocks you own or ones you’re considering to buy in a chart format with the indicators. Look at your most successful trades and see how the indicator behaved. Or, look at a group of the best stock market performers with various indicators enabled.
Remember, the first thing to look for in technical analysis stock trading is to look at how price is moving. If you asked me to pick one indicator as a starting point, I’d say look at
moving averages
– they’re very easy to understand and to begin to get a general sense of the study of how price is moving.
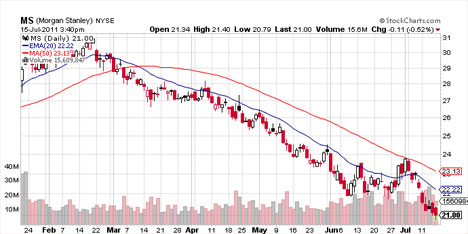
For example, open up a chart and add a 20-day simple moving average and 50-day simple moving average. Now look at the chart and ask these questions:
Where is the last price of the stock in relation to the two MA lines?
Is it above both lines? Between them or below both MA lines?
Is the 20-day above the 50-day? Or, below?
Has there been a recent crossover between two MA lines? Or, has there been recent price move over a MA?
In the example of Morgan Stanley (MS) above you can easily see the price first moved below the blue, 20-day moving average line. The price then moved below the red, 50-day moving average line and continued for the most part to stay below that line. The 20-day moving average line then also crossed below the 50-day moving average line.
If an investor was dollar cost averaging every month into this position, it would have been quite disappointing. One could have speculated all the way down on MS, but understanding technical analysis stock trading will put you "in the know" of what a stock's price is doing. Looking at these simple lines on any stock chart will give you immediate information about how the stock’s price is moving and the ability to make much better decisions for taking positions.
Tip: As you move forward you can set up a
stock market screener
for the stocks that present the setups you’re looking for to trade.
There are no rules here. Except the ones you set for your trading. One can be strictly a fundamental trader, a technical trader, or a fundamental with technical trader. It’s up to what your philosophy about the things affect the price of a stock. Just know that if you use some method of technical analysis with any fundamentally appropriate stock you can take your trading to the next level.
Options are a solid weapon to have in your investing arsenal to hedge positions or manage risk. Learn from the 2019 U.S. Investing Champion, Trader Travis.
How a Simple Line Can Improve Your Trading Success
"How to draw a trendline" is one of the first things people learn when they study technical analysis. Typically, they quickly move on to more advanced topics and too often discard this simplest of all technical tools.
Read more...