Reading Stock Charts Made Easy
SPONSOR:
The trend is your friend! Click here to see the Top 50 Trending Stocks.

The skill of reading stock charts can dramatically increase your stock trading profits. They say a picture is worth a thousand words and in stock trading, I agree.
A stock chart is a visual representation of the stock’s price activity. When company-related or market events occur or company fundamentals change, the public reacts by buying or selling the stock. The price then reflects what the majority believes about the value of that stock.
A stock chart shows you the good, the bad and the ugly. It's a visual representation of a company’s news, its perceived and agreed upon value, its earnings, its management - it even reflects the anticipation of news. It’s all right there.
Even if you love fundamentals, don’t trade without knowing how to read stock charts and having some technical knowledge of indicators. It will only make you a better stock trader or investor.
Reading Stock Charts
What is a stock chart? It’s essentially bars and lines on a graph of price, time and volume. It’s also packed with other information, including the following:
- Stock symbol, company name and on which exchange it’s traded
- Daily key price points
- Volume for the day
- Price and percentage change for the day
- Price range the stock is trading
- Period of time
- A key of indicators laid over the price action (e.g., Moving Averages (MAs), Parabolic SARs, Volume)
- Volume range
- Separate graphs of additional indicators
Here’s a labeled example of a basic daily stock chart:
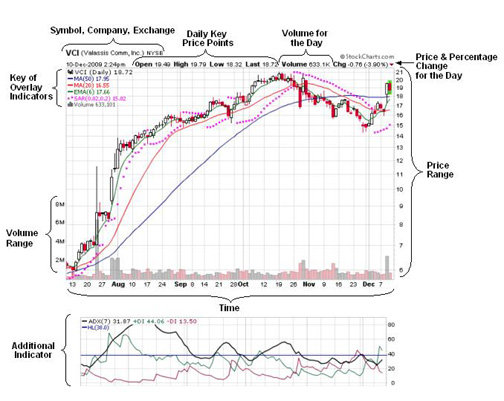
At the center of the chart graph lines is the price action. If it’s a daily stock chart, you’ll see the day-to-day movement of the price over a specific amount of time. Most charts are available as intraday, daily, weekly or monthly charts.
There are a few ways to read the stock chart's price action – there are lines, bars, dots - but there is one type of price bar that really tells a story and that’s Japanese Candlesticks. Just one look will give you a wealth of information. Immediately the color of the bar will tell you if the stock closed up or down for the day (over the previous day’s close). It will tell you if the bulls or bears had more control and how large the movement was compared to previous days. If you’re a visual person, knowing how to read this kind of stock chart will really work well for you.
The next step is to determine what you want to see on a chart. There are many indicators that work well when dropped in over the price action, including:
- Simple Moving Averages
- Exponential Moving Averages
Parabolic SARs
- MA Envelopes
- Bollinger Bands
- Keltner Channels
- Price Channels
- And a few others depending on your source for charts
In the stock chart example above, you’ll see three lines following the price action - two simple moving averages – 50-day and 20-day and a 6-day exponential moving average. The pink dots represent the
Parabolic SAR indicator.
Most other indicators work better in separate boxes either above or below the main price chart. In the example above, the ADX (7) is shown below the main price chart.
As you continue to learn how to read stock charts and indicators there are some questions to ask including the following:
- Does the price movement exhibit strength or weakness? Do you see more full, white bars in an upward movement? Or, are there a lot of red bars?
- Is there higher than average volume?
- Is the price clearly trending in a direction? Are the moving averages (MAs) moving upward with the price bars above the lines? Or, are they flat or moving downward?
- Is there a resistance point? Has the stock price cleared the highest price over the last six months or more? Or, has it broken down below a low point?
- How volatile is the price range? Are the daily percentage gains so large that the stock probably won’t sustain those kind of gains for very long? Or, are the daily gains small, but consistent?
- Is it an intraday, daily, weekly or monthly time frame?
- Are there any chart patterns you can identify? Do you think the stock price will increase or decrease?
If you aren’t yet comfortable reading stock charts, don’t get discouraged. It’s a lot to understand, but after looking at them for a short time you will come to enjoy what each one reveals about a company and the value of it's stock.
With just a bit of practice it will start to become easy to read stock charts and at that point, you'll understand how reading stock charts is vital to apply to your
stock trading strategies.
If you're still a bit unsure reading stock charts and are unclear about what you are looking for, you can move on to understanding some basic indicators like
moving averages
or
parabolic SAR,
or to
Best Stock Trading Charts of 2010
or
Historial Stock Charts of 2009
to see what some really big gainers look like.
Back from Reading Stock Charts to Learn Online Stock Trading.