Moving Average
as a Trend Indicator
SPONSOR:
The trend is your friend! Click here to see the Top 50 Trending Stocks.

A moving average (MA) is an average of price over a defined period of time for a stock or index. The line generated by this formula will signal a trending (upward or downward) or a non-trending price direction of a stock or index.
You’ll frequently see a combination of two time periods applied to a chart. Popular combinations are:
- 10 and 30
- 20 and 50
- 50 and 200
These lines will give you significant information about how price is moving. For example, when both lines are simultaneously moving in a direction or crossing over one another.
There are two common, but slightly different MA calculations – simple and exponential.
Simple Moving Average (SMA)
The SMA is calculated by taking the closing price of a stock or an index for a number of days, adding them up and dividing the figure by that number of days to get a SMA of price.
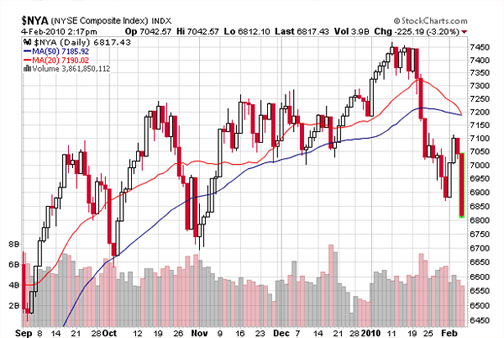
In the example below of the $NYA (NYSE Composite Index), the 20-day (red line) and 50-day (blue line) SMA overlays are applied to the chart.
Exponential Moving Average (EMA)
The EMA is basically the same calculation except more weight is given to the latest data focusing more emphasis on what an index or stock price is doing more recently.
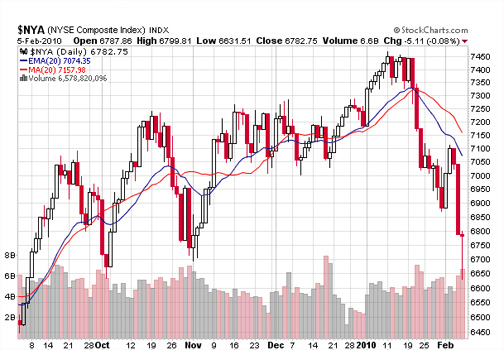
In the comparison example of the 20-day SMA and the 20-day EMA in the same chart below, you can see how the EMA moves at a tighter pace to the price bar than the SMA in following the direction of price.
SMAs and EMAs can also be combined and used as buy and sell signals. Take a look at a similar MA application for the stock chart of Talbots (TLB). The SMA remains at 20-day, but the EMA is tweaked to a 15-day.
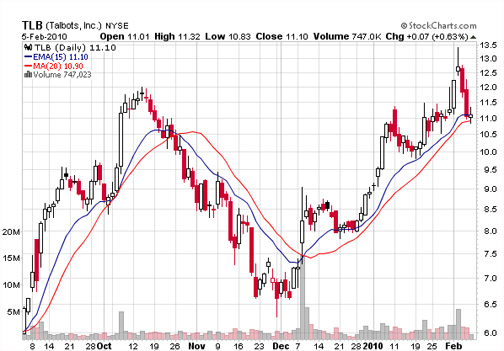
Clearly, if one followed the moving average cross of the 15-day EMA crossing over the 20-day SMA it would have been a successful single-stock strategy for both long and short positions.
The caveat here is that you have to find the kind of stock that likes to gently trend like TLB. However, you will spot them as you go about looking at charts, and they are worth noting for future trades if they continue to behave in the same manner.
MAs and Market Direction
SMAs and/or EMAs are a great way to help determine market direction and stock price direction too. Questions to ask are:
- What’s the general direction of the MA lines? Are they trending upward, downward or are they more flat (horizontal)?
- Has there been a recent moving average crossover?
- Are the price bars above or below the MA lines?
In the example above of the $NYA (NYSE Composite Index), a 20-day SMA (red line) and a 50-day SMA (blue line) are shown. As you can see both SMAs have had a pretty good upward movement until the last part of the chart where both lines are trending downward. In fact, they are positioned for the first moving average cross for the whole of this chart.
This would signal a poor time to go long in the market. Notice the close has been below the 20-day and 50-day MA for several days now – not a strong signal to get into a long position in any stock.
There’s absolutely no reason to swim against the tide when you can wait for the current to be at your back, giving the stocks you buy good market support.
You can adjust the MA time periods for as tight or broad a picture you want to get of market movement. It’s completely dependent on what kind of trader you are and the frequency of your trades.
Look at a 50-day MA or higher to get a broader picture of what direction the market is headed, and less for a closer view.
As you have seen, the
moving average indicator is one of a few easy-to-use tools for determining market direction.
Return to
Online Stock Trading Warrior Home.