


|
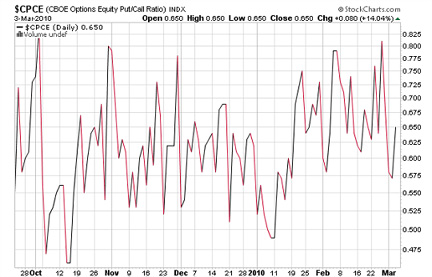
Equity Options Trading as a Market Direction IndicatorSPONSOR: For determining market direction, $CPCE equity options index is a bit more advanced but an interesting indicator of market sentiment. The put/call ratio reveals the overall selling to buying sentiment by dividing the number of equity put options (short) to equity call options (long) being purchased and plots the resulting figures in a line in the daily chart example below.
You might think, the example above doesn’t do much for me and what does options trading have to do with market trends. However, with the placement of a few lines that indicate extreme sentiments this becomes a valuable contrarian indicator.
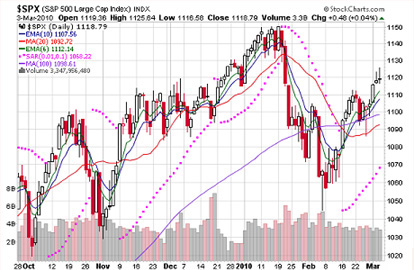
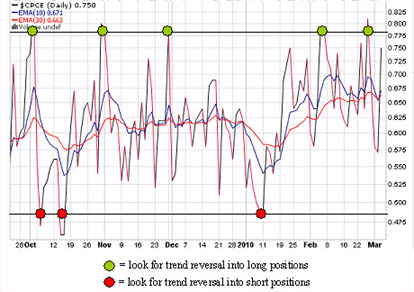
In the example below, the S&P 500 is lined up with the $CPCE so you can see how the $CPCE stacks up as a contrarian indicator. The abnormal spikes crossing over the top and bottom lines in the $CPCE part of the chart frequently correlate to near-term reversals of the market trend.
The red dots along the lower line point out lower put to call option buying or a larger amount of call options (long) being purchased and two out of three red dots resulted in a near-term downward reversal. Like many things in stock trading, the equity options trading $CPCE index is not 100% accurate, and having the ability to read other indicators along with it will help to give you a broader perspective on market direction. For instance, consider Japanese Candlesticks, ADX, moving average crossovers or another indicator that you feel comfortable with and is applicable. Having said that, the $CPCE as a contrarian indicator has a high percentage of probability in predicting a short-term trend. If you're comfortable determining market trend you can move on to the next step in a
stock trading system,
finding
good stock candidates. |

Search Stock Trading Warrior
Learn about Options

Options are a solid weapon to have in your investing arsenal to hedge positions or manage risk. Learn from the 2019 U.S. Investing Champion, Trader Travis.
Stock Market Insights
Want a peek at DOW Jones Industrial Stocks that are beginning to trend?
Click HERE!
Learn Trend Trading!
Free Videos
Presented by 30year Market Veteran Adam Hewison
What really makes a stock price rise? To find out watch:
Stock Market Insights
How a Simple Line Can Improve Your Trading Success
"How to draw a trendline" is one of the first things people learn when they study technical analysis. Typically, they quickly move on to more advanced topics and too often discard this simplest of all technical tools. Read more...
a Trend?... Find Out Now!
Online Stock Brokers
Read the online brokerage discussion...