Stock Market Portfolio
Position Sizing Using ATR
SPONSOR:
The trend is your friend! Click here to see the Top 50 Trending Stocks.

How Much Should I Invest in Any One Stock?

To protect your stock market portfolio, the trick here is a defensive play, and it’s as the saying goes – “Live to play another day.” Before investing your hard-earned money, know that there are two parts that work together in figuring out how much capital from your stock portfolio to invest in any one stock – your risk tolerance and the individual stock price's volatility.
This series on position sizing includes:
Risk Management Position Sizing Primer - Understanding Your Risk
General Position Sizing Information
...and this page is on Position Sizing Using a Stock's Average True Range
Risk Tolerance
The first question is how much money of your stock market portfolio are you comfortably willing to risk? When I say risk, I mean how much are you willing to lose on any one trade? To preserve capital so that you can trade another day, the general rule is to be willing to risk or lose no more than 1-2% of your total stock market portfolio on any one trade. If you’re more conservative, 1% might be the right figure. As an example, a $10,000 portfolio with a 1% risk tolerance would mean that on any one trade you are willing to lose $100.
This strategy gives you a good layer of protection. Consider that if you had five losses in a row that would total $500, and that’s 5% of your stock market portfolio. The good news is you would still have $9,500 to trade another day.
Once the risk amount for a position is calculated, a
stop loss order
is put in place to protect the majority of your capital.
If you want to read more about risk tolerance visit:
The Risk Management Position Sizing Primer.
Price Volatility and Average True Range
Once you’ve figured out how much you’re willing to risk, there's still the fact that all stocks are not created equal. Some are more volatile than others and risk increases with volatility. So how do you balance both risk and volatility?
What you have to do is look at the volatility of each individual stock that you're considering as a possible trade.
A great strategy is to use the Average True Range (ATR) indicator as a way to gauge the price volatility of each stock and balance that with how much you're willing to risk. Stocks move in different daily price ranges and ATR is the measurement of how much a stock price fluctuates per day averaged over a number of days.
The ATR will do two things:
- Show you how volatile a stock is, and
- Help you calculate how much capital to use based on your risk tolerance.
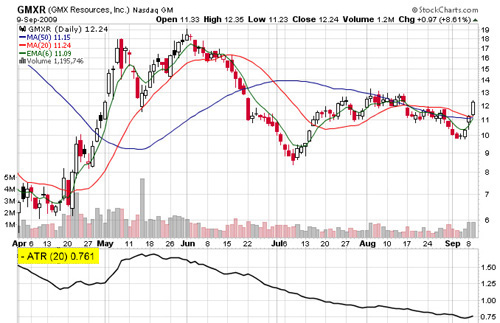
In the chart of GMXR below, you can see in the highlighted area that the ATR (20 day) is .761. This means the daily price range averaged over the past 20 trading sessions is .76 cents and you can comfortably expect the stock to have a daily swing of at least .76 cents.
Using the current stock price, the ATR and the $100 risk amount, you can create an Excel spreadsheet (see example below) as an easy way to quickly determine position size as well as volatility on individual stocks. If you enter the current price of $12.24 and the ATR of .76 cents for GMXR, you can quickly get a picture of what the price volatility percentage is and how much more volatile that stock is compared to other choices you’re considering.
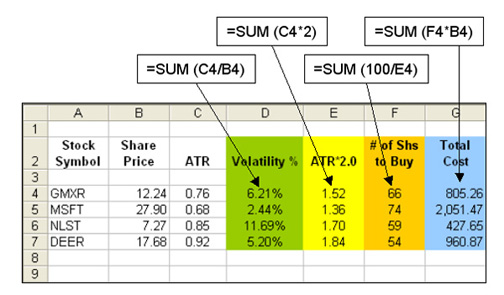
As you can see in Column D (Green) the price volatility for GMXR is 6.21%. As you find possible candidates to purchase you can plug them into this spreadsheet to compare volatility. When comparing stocks side-by-side, you may decide to avoid the more volatile ones.
Given the .76 average daily price swing of GMXR (Column C), it's very likely that the price will fluctuate .76 on any given day so you want to base your purchase on a wider variable of the ATR so that the risk tolerance of 1% or $100 isn't reached too easily without giving the stock a chance to go in your favor.
Generally, 1.5 or 2.0 of the current ATR will give the stock plenty of room to move around. In the spreadsheet above, Column E (Yellow) calculates twice the ATR figure from Column C and for GMXR that is $1.52. What this figure does is keep the risk control factor on track and allows for an acceptable daily price range.
Column F (Orange) then calculates how many shares to purchase by taking the maximum risk allowance of $100 and dividing it by $1.52. Column G (Blue) then calculates the total equity needed to purchase those shares. With GMXR you would purchase 66 shares for a total of $805.26.
As you look at the choices you’re considering on this spreadsheet, you’ll notice that MSFT has a lower volatility and the total cost to purchase is a higher capital investment. A couple of things to consider are:
- You can always set a maximum initial amount from your stock market portfolio to invest in any one stock. In this case, maybe it’s a $1,000 maximum investment so that your portfolio isn’t too heavily invested in one stock.
- Also, the lower volatility stocks may be slower gainers compared to ones with a mid-range volatility. For example, the 2.44% price volatility of MSFT also indicates that as the stock gains, it could potentially gain 2.44% per day versus 6.21% per day for GMXR. Which one would you prefer to have in your stock market portfolio?
When you decide to enter into a cycle of trading, you may also want to limit how many positions you open at one time. Purchasing two or three stocks and waiting for those to go in your favor protects you from any market instability. Once those stocks have increased you can comfortably look for other winners or purchase more of the biggest gainer if it's continuing to perform well.
To summarize the basic rules, they include:
- Know how much you’re willing to risk.
- Use ATR to measure a stock’s volatility.
- Calculate position size using the ATR.
- Have a maximum initial trade dollar amount.
- Limit the number of positions in your stock market portfolio when beginning any cycle of trading.
Beginner investing becomes so much easier when you have these
money management
strategies in place before you begin trading.
Go from Stock Market Portfolio Position Sizing to the next step of a stock trading system - Successfully Selling Stock.
Return to Online Stock Trading Home.
Note: These strategies are based on strategies that the “Turtles” used to control risk. If you haven’t read about “Turtle Trading,” I highly recommend you read about who they were, how they came about and the trading rules they used.