Tracking Stock Trades
SPONSOR:
The trend is your friend! Click here to see the Top 50 Trending Stocks.

Tracking Daily Trades01/13/12 UPDATE: Want help tracking stock trades? Sign up for the What's New at Stock Trading Warrior newsletter and receive FREE the daily, monthly and yearly tracking forms for your trades as seen below!
This method of tracking trades is done using an Excel spreadsheet to record each trade you make. What this does is show you how you’re doing with each trade and makes tracking stock trades easy and enjoyable! The spreadsheet should include the following:
- Symbol
- Purchase Price
- Number of Shares
- Sell Point
- Gain/Loss Amount
- Commission/Fees
- Percentage Gain/Loss
- (Date, if desired)/li>
The tracking stock trades spreadsheet will look something like this:
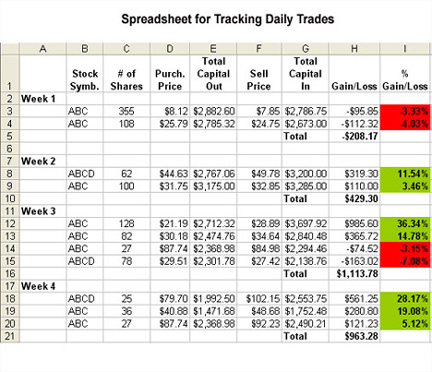
In excel, you can use the fill function to color the final % Gain/Loss cells for a quick visual on gains versus losses. This can help you see if you've had several losses in a row and give you a signal that you might want to step away from trading for a few days.
Combine the week’s group in batches with a total gain/loss for the week. The weekly total gain/loss figure will plug into the next spreadsheet.
For a more sophisticated trade tracking program that provides excellent tracking ability for current positions or for monitoring watches
buy TradeTrakker.
Tracking Monthly Progress
This spreadsheet shows you how you’re doing weekly, monthly and annually. The $10,000 portfolio is used in this example.
At the top you’ll see each month and in the left-hand column, the corresponding weekly total gain/loss from the prior worksheet “Tracking Daily Trades.” In this example, each week is color coded for a week of a total gain (green) or loss (red).
On Line 9 the total for the month is then calculated at the bottom of the column. Line 10 calculates how the gain/loss compounds over the months and Line 12 adds that figure to the original capital of $10,000. A sample of what it should look is this:
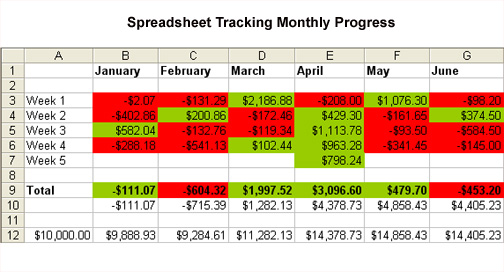
This really gives you a big picture of how your trading is going, whether you’re on track and should continue doing what you’re doing or stop and take a look at your stock trading methods.
Comparing Progress to Goals
At some point, as you put together your trading strategy, you’ll need to think about what your goal is for earning a profit. It should be a percentage that you think is challenging but also attainable.
Using an expanded example from the section, “Tracking Monthly Progress,” below you’ll see a spreadsheet displaying the monthly gain/loss results of an example portfolio.
However, on the spread sheet below a few more things are added. Line 15 provides an example of an earning goal of 5% per month with $10,000 capital. Line 16 and 17 show how this would compound over time.
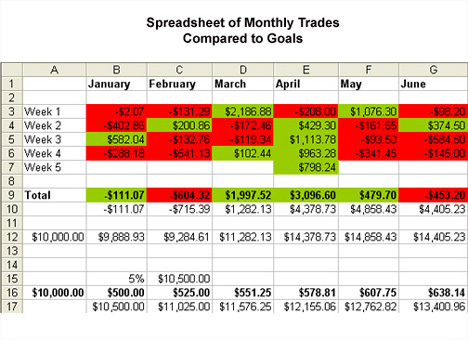
What this gives you is a way to compare your actual stock trading performance with a goal that you have set. If you are not hitting that mark over a few months, you should take a look at your
stock trading strategies
or how the markets have been performing and make adjustments. Maybe the
stock market trend
was not trending or it was reversing, making it more difficult to capture a gain. Whatever the possible stumbling blocks are, if you set goals and compare them to your actual progress you will know if you need to improve.
Ultimately, by
tracking stock trades and grading your trades, you will improve your trading by being aware of exactly how well you are doing.
Return from Tracking Stock Trades to The Path to Better Trades.
Return from Tracking Stock Trades to Online Stock Trading Warrior home.
For a more sophisticated trade tracking program that provides excellent tracking ability for current positions or for monitoring watches
buy TradeTrakker.