


|
Rolling Stocks Trading StrategySPONSOR: The strategy of rolling stocks is to find a stock that is oscillating or rolling from about the same high point to about the same low point or what's also called a stock price's support and resistance points.
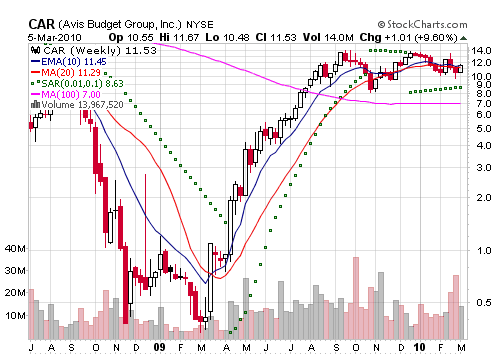
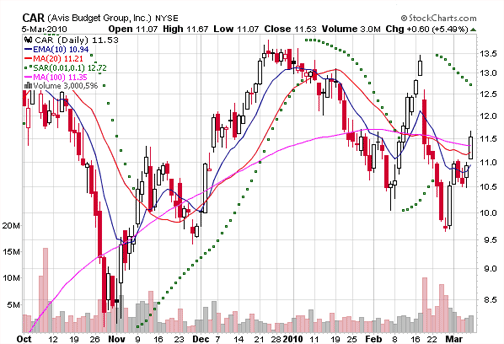
One of the best ways to find a rolling stock is to look for stocks that have had a big run up like in the example below of the two charts of CAR. The first is a weekly chart showing the run up and the second chart is the daily chart.
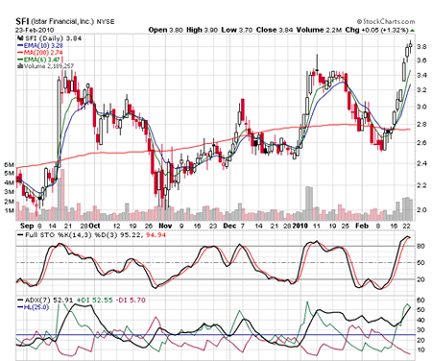
A flat-line moving average can also tip you in on a stock that's rolling and then it’s a matter of waiting for the proper price position as in the example below:
Below is another example of a rolling stock that's trending slightly upward, but you can see that after it rolls below the 200-day moving average and the stochastics go above 20 the stock price moves upward. The confirming indicator of the +DI and ADX rising over 25 works well here by eliminating either false or weak upward movements in the stock price.
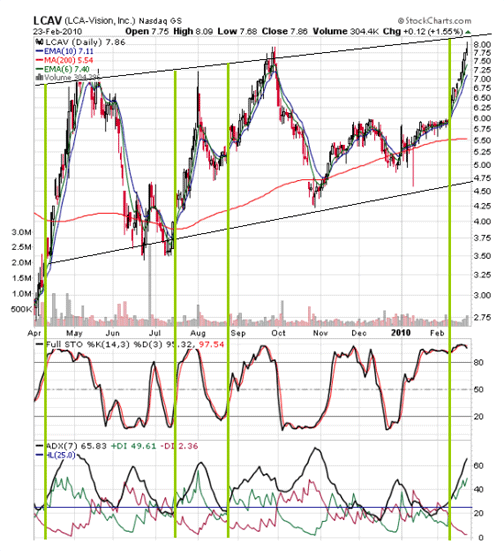
Each green vertical line signals one of four (!) entry points corresponding with +DI above 25, ADX above 25 and RISING combined with the stochastics above 20. As you can see, there were some false stochastic signals and that's why an additional confirmation is needed. As for the exit strategy, the use of a trail stop on the 6-day EMA would have worked well. The chart is kind of hard to see but, using the entry strategy from the chart above and the 6-day EMA the gains would have been 73%, 19%, 18% and 23% to date. One of the tricks here is to know that the roll doesn’t continue indefinitely and so, it’s not completely predictable. The good news is that when stock prices break out of a roll it has a 50% chance of breaking out on the up side for additional gains. Traditionally, rolling stocks are priced at $5 or less, but there are very good rollers up to $15. The lower price point is based on profitability, as higher priced stocks tend to gain slower than lower priced stocks so there’s a diminishing return on higher priced stocks as you can see below: Stock A at a price of $5 rises $2 = 40% gain Stock B at a price of $10 rises $2 = 20% gain Stock C at a price of $20 rises $2 = 10% gain Stock D at a price of $30 rises $2 = 6.7% gain The nice thing is you can get a sense of the potential gain as you compare where the stock price is now and use the last resistance point for where the price might go next. This does two things - you can eliminate rollers that are a smaller percentage return, and you can put a trail stop on at or near the resistance point. Rolling Stock Strategy What kind of stock (parameters): stocks with volume over 100,000 shares traded daily, traditionally stocks priced at $5 or less, but there are very good rollers up to $15 What’s used (probabilities): Stochastics, short-term moving averages, candlesticks, ADX/DI Market direction: Non-trending What to look for (setup): stocks that are non-trending (or rolling), look for a flat or gently rolling 100 to 200-day moving average line Entry: Long - stochastic breaks above 20 after being below, look for a bullish (go long) candlestick, also look for a confirmation of some sort (+DI crossover –DI) or for Short - stochastic breaks below 80 after being above, look for a bearish (go short) candlestick, also look for a confirmation of some sort (-DI crossover +DI) Exit: Look for reversal candlestick, Price/EMA cross, DI (7) cross, parabolic SAR reversal The "roller" strategy can work really well and be a great strategy for you to keep tucked away in your trading toolbox for a non-trending market. Rollers can be like finding a little gold mine when you find a good one. Using the rolling stocks trading strategy is one of several good stock trading strategies you can implement. |


Search Stock Trading Warrior
Learn about Options
Options are a solid weapon to have in your investing arsenal to hedge positions or manage risk. Learn from the 2019 U.S. Investing Champion, Trader Travis.
Stock Market Insights
Want a peek at DOW Jones Industrial Stocks that are beginning to trend?
Click HERE!
Learn Trend Trading!
Free Videos
Presented by 30year Market Veteran Adam Hewison
What really makes a stock price rise? To find out watch:
Stock Market Insights
How a Simple Line Can Improve Your Trading Success
"How to draw a trendline" is one of the first things people learn when they study technical analysis. Typically, they quickly move on to more advanced topics and too often discard this simplest of all technical tools. Read more...
a Trend?... Find Out Now!
Online Stock Brokers
Read the online brokerage discussion...